Testing the Theory: 2021 - 24
I. Examining Lunar Oscillations in 3-D.
Key Points under Scrutiny
The apparent anomaly of a transitory switch of horizontal direction occurring in the Lunation spanning the Midsummer solstice required an explanation. Could changes in wavelength be responsible? To test this theoretical scenario more hard evidence was sought from other exterior locations in a concerted effort to establish what this somewhat odd pattern of movement might look like in the vertical plane.
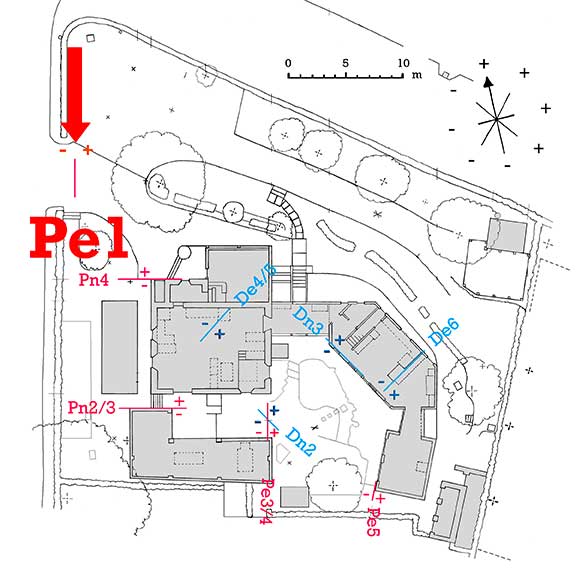
The 'Daily' Vertical data from Pe3[a]-Upper Courtyard amassed in the autumn of 2017 although detailed, covered only a fragment of the year (refer back to figs. 2.62/63/64/65). These graphs had highlighted the fact that the earlier vertical plane data, collected only once every 7 days from wherever around the site, was insufficient to allow positive conclusions to be reached regarding how lunar oscillation movements might be operating throughout the remainder of the year. More comprehensive vertical plane 'Daily' data was needed, from December through to August, to extend what had initially been revealed and provide more information on changes in wavelength over time. Thus, as a supplement to the previous 2017 data, daily observations were restarted at Pe3[a]-Upper Courtyard commencing with Lunation 1215, on 10th Mar., 2021, just before the Vernal Equinox. (For time and safety reasons, observations were trimmed to only 5 vertical points spanning a reduced height of 1.05 metres).
Concurrently, a complementary set of specially selected observations was
initiated at vector Pe1-Entrance, but here made entirely in the
horizontal plane. This was a new location: ≥0.75m above the bedrock and over
20 metres from the courtyard. By making a
spread of observations all at ground level it was hoped that when the
data from these two independent locations was combined, the former giving a
sectional view and the latter a plan view, they would have the capacity to yield
results that gave a continuous 3-D picture of the waveform in the 'Mid-Zone'
from one lunation to the next, and span the whole yearly cycle.
*NOTE: Observations at Pe1 were initially made at only 2 points, 1.64 m apart but, in July'21, they were extended to 5 points spanning a 3-metre, north to south length of the wave.
The initial pair of graphs derived from the two locations, spanning lunation 1215 (see fig.2.82 below) confirmed that the switch from the Winter polarity arrangement (as originally recorded in the Autumn 2017) was already underway at both locations. Thus, during the 7-days spanning the New Moon on 13th Mar. 2021, oscillations moved steadily eastwards over a wide range (>1.5 m) i.e., away from the western segment they normally occupied all winter. This resulted in the subsequent Full Moon oscillations replacing them in the 'negative' West segment and meant that the bi-annual polarity reversal to the 'Summer' position was already complete after the Spring Equinox. The New Moon oscillations that followed at the beginning of April (lunation 1216) all occurred in the 'positive' East segment.
Fig. 2.82. Lunation 1215: Comparison of Daily Oscillations in the Vertical & Horizontal planes - Mar/Apr 2021
However, in the middle of lunation 1216, in early May, indications of a shortening of wavelength took place at Pe1-Entrance. Full Moon oscillations drifted towards the East (marked by blue arrow in fig. 2.83 below) followed by New Moon oscillations (brown arrow) shifting towards the West as lunation 1217 commenced. Further evidence of this shortening of wavelength became apparent during lunation 1217 at Pe3[a]-Upper Courtyard (see brown arrow marking New Moon oscillation switch in fig. 2.84 below). Thus, both locations showed clear evidence that the 'Low' IP-Λ on the wave must be rising from below Ground Level (GL) up to a height >1.05 metres and passing through the two fixed observation points as wavelength shrank.
Fig. 2.83. Lunation 1216: Comparison of Daily Oscillations in the Vertical & Horizontal planes - Apr/May 2021
Fig. 2.84. Lunation 1217: Comparison of Daily Oscillations in the Vertical & Horizontal planes - May/June 2021
During Lunations 1218 & 1219, after Midsummer and the Aphelion, the New Moon period returned to oscillating in the East while Full Moon's oscillated in the West i.e., they resumed their 'Summer' positions (see figs. 2.85 & 2.86 below). This was a symmetrical movement consistent with the 'Low' IP-Λ dropping back below ground level as wavelength began to expand again.
Fig. 2.85. Lunation 1218: Comparison of Daily Oscillations in the Vertical & Horizontal planes - June/July 2021
Fig. 2.86. Lunation 1219: Comparison of Daily Oscillations in the Vertical & Horizontal planes - July/Aug. 2021.
Just before the Autumn Equinox, in late August, during Lunation 1220 the Full Moon oscillations shifted towards a 'positive' East position at Pe1-Entrance and overlapped those of the previous New Moon (see fig.2.87 [L] below). This change of movement was repeated in the vertical plane at Pe3[a]-Upper Courtyard, where a similar switch of polarity took place: New Moon oscillations shifted to 'negative' West (marked by the arrow in fig.2.87[R]). Thus, by the time of the actual Autumn Equinox, the change to the 'Winter' arrangement had already taken place.
Fig. 2.87. Lunation 1220: Comparison of Daily Oscillations in the Vertical & Horizontal planes - Aug/Sep. 2021.
In the following Lunation (1221) Full Moon oscillations occurred in the 'positive' East sector (see fig.2.88 below) and remained in this quarter from Oct'21 to early Feb'22 thus, spanning Lunations 1221 to 1225. Meanwhile the New Moon oscillation pattern consistently swung towards 'negative' West throughout this whole 5-month Winter period. (See series of figs. 2.88, 2.89, 2.90, 2.91, & 2.92 below).
Fig. 2.88. Lunation 1221: Comparison of Daily Oscillations in the Vertical & Horizontal planes - Sep/Oct. 2021
Fig. 2.89. Lunation 1222: Comparison of Daily Oscillations in the Vertical & Horizontal planes - Oct/Nov. 2021
Fig. 2.90. Lunation 1223: Comparison of Daily Oscillations in the Vertical & Horizontal planes - Nov/Dec. 2021
Fig. 2.91. Lunation 1224: Comparison of Daily Oscillations in the Vertical & Horizontal planes - Dec'21-Jan'22
Fig. 2.92. Lunation 1225: Comparison of Daily Oscillations in the Vertical & Horizontal planes - Jan/Feb. 2022
The overall pattern recorded over this period was very similar to that seen 4-years earlier (refer back to Autumn 2017 figs. 2.62/63/64/65). The results confirmed that the Full Moon/New Moon reversal of orbital position, from perigee to apogee, over that period was not the critical factor affecting the 'Polarity Switch' seen at this particular ground level observation height. It instead appeared to be governed by whether the orbital path of the 'Full Moon + Earth' lay between the Sun and the Galactic centre (during the Summer period) or was out beyond both the Sun and the Galactic centre (during the Winter period).
Such a conclusion suggested that in the summer, when the Full Moon accelerations move in the same direction relative to the sun's galactic path, the polarity of the wave in the GL 'mid-zone' is negative 'West'.
Conversely, when the accelerations move in the opposite direction to the sun's galactic path, as they do in the winter, the polarity of the wave reverses and in the GL 'mid-zone' becomes positive 'East' .
The pivotal point at which this switch of polarity takes place is in the 14 to 21-day period just prior to the points of Vernal and Autumnal equinox i.e., in the last few days before the lunar orbital path crosses the Sun's galactic orbital path.
The projected annual pattern of lunar movement was confirmed when polarity returned back to the 'Summer' mode just before the Spring Equinox in late Feb/early Mar'22. Thus, in the last few days of lunation 1226 the New Moon oscillations at Pe3[a]-Upper Courtyard began shifting towards the 'positive' East 'Summer' position (marked by an arrow in fig.2.93 below) and overlapped the previous Full Moon oscillations. The result was that by the time of the Spring Equinox 2022 (spanned by lunation 1227 - see fig. 2.94 below) the switch was completed and Full Moon oscillations now moved in the Summer 'negative' West sector – taking up the same position they had occupied a year earlier.
Fig. 2.93. Lunation 1226: Comparison of Daily Oscillations in the Vertical & Horizontal planes - Feb/Mar. 2022
Fig. 2.94. Lunation 1227: Comparison of Daily Oscillations in the Vertical & Horizontal planes - Mar/Apr. 2022
A graph giving an overview of the whole lunar cycle at Pe3[a]-Upper Courtyard, taken at a height of 1.05 metres and spanning the period from Spring Equinox 2021 to '22, was compared to the GL oscillations there (see fig.2.95 below). The graph clearly showed that the cyclical movements that had been recorded over the course of the year were consistent with earlier 'Daily' observations made at GL during 2015-16 and made in 2016-17 (refer back to fig. 2.61); and in addition, similar confirmatory lunar oscillations had been recorded at De6-Lawn spanning this same 2-year period (refer back to fig.2.60).
Fig. 2.95: Daily Lunar Oscillations at Pe3[a]-Upper Courtyard: Year - Mar. 2021 to Mar 2022.
In Autumn 2021 supplementary observations had also been re-started at De6-Patio and the daily results for the 'Winter' period from 17th Oct'21 to 4th Apr'22, showed that Full Moon oscillations at De6-Patio although small (±0.50 m) consistently shifted towards 'negative' NW (see fig. 2.96[L] below). This movement was completely the opposite to the Full Moon 'positive' SE oscillation pattern (±0.75m) seen over the same period at Pe3[a]-Upper Courtyard (a location clearly identified as being in the 'Mid-Zone'). These findings added further confirmation that the De6-Patio location must occupy the adjacent 'Upper Zone' throughout the Winter and that the 'Central' Inflection Point (IP-X) must be situated close below.
However, over the critical Spring Equinox period, when a change in polarity could be expected, the Full Moon oscillations at De6-Patio continued to swing towards 'negative' NW rather than switching to 'positive' SE (see fig. 2.96[R]). This suggested that 'Central' IP-X must have risen and passed through the fixed location, apparently due to a 'Summer' decrease in wavelength , and resulting in De6-Patio now occupying the 'Mid-zone' just below IP-X. Evidence from the rest of the 'Summer' showed that the location remained in this 'Mid-zone' throughout the period but, because of its higher position in the 'Vertical Plane', De6-Patio did not display the short Midsummer polarity reversal seen at Pe3[a]-Upper Courtyard.
Fig. 2.96. De6-Patio Winter (L) & Summer (R) Lunar Oscillations: Year Oct. 2021 - Sept. 2022
To allow a comparison of the 'Exterior' Annual Lunar Oscillation Cycle with the Annual 'Interior' Cycle, where little or no lunar activity appeared to occur, required monthly oscillation averages to be calculated over the course of a year. By the Spring of 2022, the full years' worth of 'Exterior' daily oscillation data from Pe3[a]-Upper Courtyard, supported by parallel data from Pe1-Entrance, and supplemented by the data from De6-Patio, made these calculations possible.
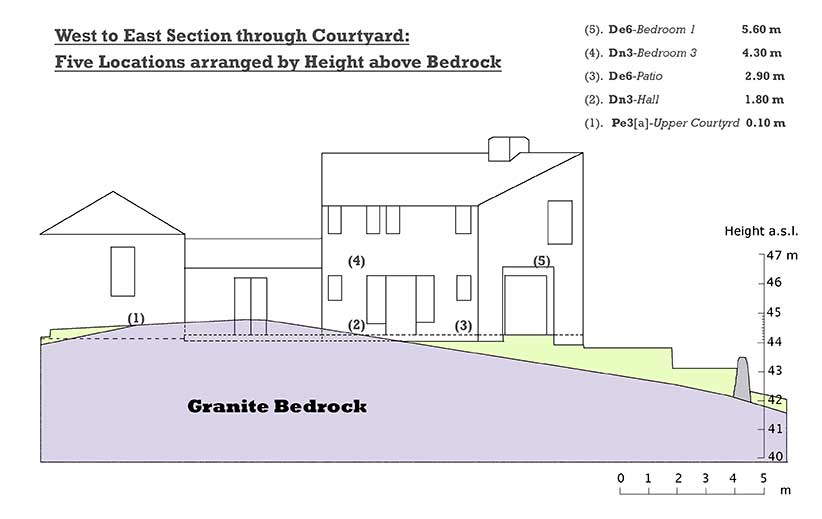
A modelling sequence of five locations was assembled, each at a steadily increasing height above bedrock (see fig. 2.97 below). The Patio location stood at a critical height in the vertical wave section close to the 'Central' IP-X and was used as a key reference point. It lay at a point where the granite outcrop dropped away steeply towards the NE at an angle somewhere between 15° to 36°.
Fig. 2.97. Five Key Locations.
Substantially different heights above the bedrock existed at the three 'Interior' locations - ranging upwards from ~ 2.0 to 6.0 metres (marked [2], [4] & [5] in fig. 2.97 above). Daily observations made in previous years on the ground floor at location [2] Dn3-Hall, had established that was clearly in the Mid-Zone, a metre or so below the 'Central' IP-X; while on the 1st floor it had been established that location [4] Dn3-BedRm3 lay in the Upper-Zone, above IP-X. The third 'Interior' point, location [5] De6-BedRm1, stood at a height ≥ 5.6 m above bedrock and displayed a small range suggesting it was very close to the next highest 'Upper' Inflection Point (IP-V).
Having calculated monthly averages for all five locations (5th of one to 4th of next month) including secondary points at heights a little above each, individual comparative graphs were then produced where the monthly averages for each location were standardized by taking the 'Equinoctial Mean' around which they oscillated as point 'Zero' i.e., taking the average of the two equinoctial months, March & September (marked with an 'X' in each of the graphs in fig. 2.98 below). From this X-point, +/- deviations from zero were then assigned to each month to create homogeneity, independent of secondary lunar movements.
Fig. 2.98. Monthly Average at Five Key Points (by Height): selected from years 2015 to 2022.
The graphs shown above allowed the data from the Five Locations to be grouped together in a way that illustrated a vertical slice through the wave section (of any one vector) and depicted a substantial part of the whole wave's annual oscillation form and showed how it was similar to each lunation cycle embedded within it (see fig. 2.99 below).
Fig. 2.99. Vertical Section showing monthly average in the Horizontal Plane at Five Key Locations: 2015-17, & 2021/22.
By arranging the data in a sequence based on the location's height above the underlying bedrock mass, the broad dimensions of the wave, in both the vertical and horizontal planes, could be estimated from bedrock to a height of around 6.0 m. The layout suggested that the average wavelength over the course of the year was in the region of approx. 5.5 m; while amplitude at ground level was close to ± 2.0 m. However, at a height of 4.6 m (in the Upper Zone - above the 'Central' IP-X) amplitude appeared to be nearer to ±1.25 m; i.e., substantially less than at GL It was unclear whether this difference in amplitude was due simply to the choice and spacing of locations, or whether it was due to a decrease as the wave rose upwards from the underlying bedrock (perhaps even by the square of the distance?) However, gathering sufficient data at the necessary heights in the vertical plane to pursue and confirm such an alternative postulation was thought to be beyond the scope of this investigation. Of more immediate importance was the similarity of the 'Annual' oscillation pattern (displayed in fig. 2.99 above) to the 'Lunar Month' oscillations recorded in the autumn of 2017 (refer back to figs. 2.62-65). Their similarity clearly demonstrated that the Lunar and the Solar patterns were closely linked in a complete and unified system whose details needed further clarification.
The outstanding problem remaining was 'the annual change in wavelength'. It had not been immediately clear whether the movement observed over the course of each year from Winter to Summer was an expansion or a contraction, or a varying mix of both. Past efforts to measure wavelengths at different times of the year had come up with figures ranging from a minimum of 3.0 m to a maximum ≥6.5 m. Over this early period, it had been assumed that the wave's length was fixed, and thus, that any differences were due to variations arising from the observer's physiological limitations and/or methodological inaccuracies. However, with the benefit of hindsight and evidence emerging from anomalies, it was realized that the shortest wavelengths had been recorded during the fine weather of the summer months while most of the longest were recorded in the Spring or Autumn, and none recorded at midwinter i.e., recording was done when outdoor weather conditions were at their least inhospitable.
To establish by just how much the wavelength might be shortening in the Summer an attempt was undertaken to measure with greater precision the distance between the 'Central' IP-X and the 'Low' IP-Λ. The initial observations made in the summer 2021 at Pe3[a]-Upper Courtyard, had established that the 'Low' IP-Λ rose upwards, from slightly below GL to a height > 1.05 m (refer back to figs. 2.83-84-85 & 2.95). Further observations, made at the same location in the summer of 2022, compared movements at Roof Height with those at GL. - the roof height of 2.66 m was close to, but a little below, the estimated 'Central' IP-X height of approx. 3.0 m above bedrock. These new measurements suggested that 'Low' IP-Λ was rising upwards to a maximum height of approx. 1.50 m (see below - Figs.2.100: May, June, & July'22 & Fig. 2.101 Midsummer Peak ).
Fig. 2.100. Pe3[a]-Upper Courtyard Vertical Lunar Oscillations: May, June, July 2022.
Fig. 2.101. Pe3[a]-Upper Courtyard Vertical Lunar Oscillations: - Midsummer 2022.
Having established that the distance from the 'Low' IP-Λ to the known height of the 'Central' IP-X at Midsummer was somewhere in the region of 1.50 – 1.60 m, then the minimum wavelength at Midsummer could be regarded as somewhere close to 3.1 metres: decreasing from an equinox maximum of ≥ 6.5 m.
Because of the overall symmetry which had emerged over the course of the investigation, this latest pattern of events suggested that wavelength might reduce in a similar manner towards a Midwinter minimum; however, the evidence appeared to show that the 'Central' IP-X did not rise but instead descended during this period. Further, there was little or no evidence of the 'Low' IP-Λ rising at Pe3[a]-Upper Courtyard in the winter of 2021/22; on the contrary, Full Moon oscillations remained in the 'positive' East segment throughout the period. Thus, all the available evidence pointed towards the likelihood that wavelength shrank in a 'downwards' direction in winter - a mirror image of its summer 'ascent'. However, it possibly did not decrease by the same degree as in the summer period, and therefore that a certain amount of asymmetry was present in the yearly cycle.
In possession of the broad working dimensions of the waveform, a stage was now reached where it was possible to develop models to demonstrate the theory.

![Pe3[a]-Upper Courtyard Site location.](https://91cb291b3f.clvaw-cdnwnd.com/adeb008a4da20be2cab6f61eae5a0983/200000227-00d3200d36/40a-Vector-Point-Pe3.jpeg?ph=91cb291b3f)

![Pe3[a]-Upper Courtyard lunar oscillation cycle at height 1.05 m above GL - Year 2021-22](https://91cb291b3f.clvaw-cdnwnd.com/adeb008a4da20be2cab6f61eae5a0983/200000421-385d7385d9/95-Pe3-UpCrtYrd-2021-22.jpeg?ph=91cb291b3f)


![Daily vertical oscillations at Pe3[a] in lunation 1231 July'22.](https://91cb291b3f.clvaw-cdnwnd.com/adeb008a4da20be2cab6f61eae5a0983/200000456-01e6901e6b/100%5Bc%5D-Pe3-July-22-8.jpeg?ph=91cb291b3f)
![Daily vertical oscillations at Pe3[a] spanning Midsummer: Full Moon to Full Moon 2022.](https://91cb291b3f.clvaw-cdnwnd.com/adeb008a4da20be2cab6f61eae5a0983/200000450-ea639ea64e/101-Pe3-Midsummer-22.jpeg?ph=91cb291b3f)