2018 - 2021
Assessment & Collation.
Reconnoitring Wave Dynamics.
A key feature of the 'Interior' Dn3 vertical sections was the almost complete absence of any monthly lunar oscillations. This contrasted starkly to the 'Exterior' sections at Pe3[a]-Upper Courtyard, which very clearly demonstrated a 29.5-day oscillation pattern (see previous figs. 2.62, 63, 64 & 65). The accumulated evidence appeared to suggest that the surrounding mass of the house shielded the interior space from lunar influences leaving it under the sway of only the annual broad solar oscillation pattern of movement. This was an important and highly significant finding of which to be aware.
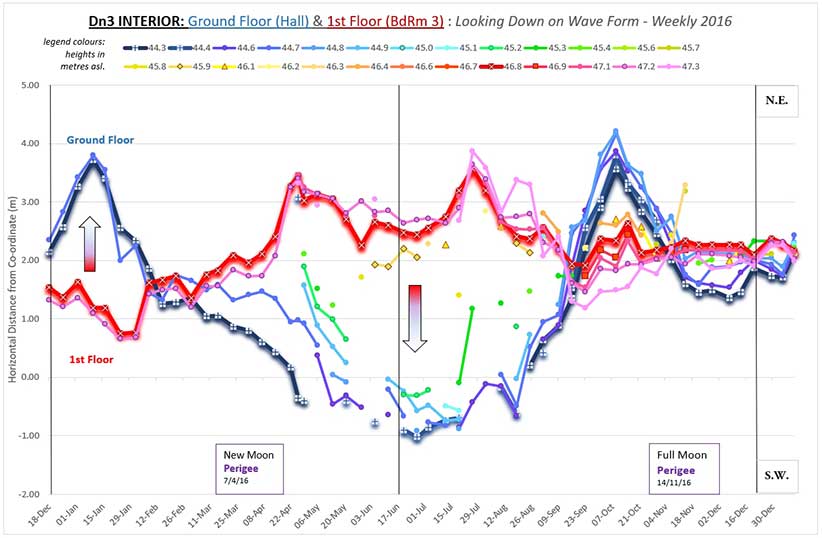
When the 2016 weekly and daily vertical section graph derived from Dn3-Ground Floor & 1st Floor observations was depicted in a single time line it gave the impression that wave amplification might be slightly larger in the 'Summer' period than that in the 'Winter' (see fig. 2.68 below). But on the other hand, this visible difference might equally relate to the influence of the substantial slope angle of the underlying bedrock, and therefore to 'the height/position on the wave at which the observation had been made'.
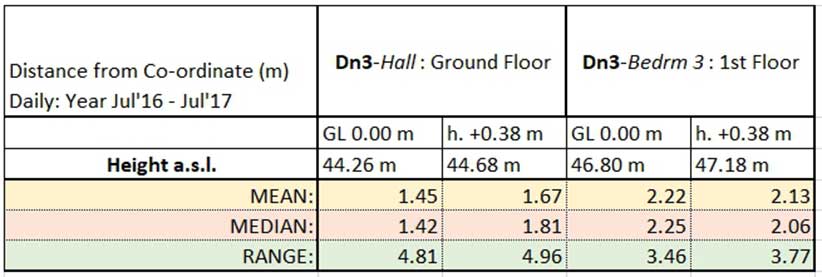
With this problem in mind the 'Section Mean' at four key heights was calculated using daily data spanning the year from July 2016 to 2017 (see Table 1 below).
Fig. 2.68: Dn3-Hall + 1st Floor Weekly 2016.
The Mean Points (above) were plotted and superimposed on a vertical section graph, which compared the varying Weekly Shape of the wave in the Summer periods of 2016 and 2017 with the wave's shape in the intervening 2016/17 Winter period (see fig.2.70 below). The line connecting the Means at successive heights appeared to be slightly curved and was inclined at approx. 15° towards NE; this gave further strength to the idea that: 'as a wave emerges from a mass it is perpendicular to the general slope-angle of that mass, but over a relatively short distance it gradually reorientates towards the vertical'. In this particular location the wave appeared to reach verticality as it approached a height of somewhere in the region of 3.5 m above bedrock The realization that the wave possessed a certain degree of flexibility promoted a new way of thinking about it.
The existence of an upward curve to the wave at Dn3-Hall had implications when it came to consideration of a wave's overall shape and form at any location. At Ground Floor Level, within the house (where Dn3-Hall sits over a substantial slope), it suggested that readings in the horizontal plane taken in the Winter period were from a slightly higher point on the wave i.e., further from the bedrock and closer to the 'inflection point'; therefore, any analysis using data from this phase was likely to show rather less amplification than in the 'Summer' phase. Statistical analysis of the horizontal plane data from the four Key Points given in Table 1 showed that this was indeed the case i.e., the ground floor (more distant from the inflection point) had a large horizontal range (4.81- 4.96 m); while the 1st floor (nearer to the inflection point) had a more modest range (3.46 m).
Fig. 2.70: Dn3-Hall & 1st Floor. Summer vs Winter: Curved Vertical Sections 2016-17.
Re-examination of a series of detailed 'Vertical Plane' sections spanning the years 2016 and 2017 at Dn3-Hall and 1st Floor suggested that the 'Central' inflection point of the wave had possibly undergone a slight up & down movement over that time - shifting over a range of perhaps as little as ±0.25 m (see fig.2.71 [a, b, c, & d] below). While no data had emerged in the earlier part of the investigation to support the theory of a large (>2.5m) 'up & down' shift, the presence of such a relatively small change had been overlooked. It was realized that a comparatively tiny fluctuation of this scale could indicate a change of wavelength and, if found to exist at other locations, might be of sufficient size to explain the anomalies in the horizontal plane Annual Lunar Pattern recorded in the past.
Fig. 2.71[a]: Dn3-Hall. Winter Solstice 2015-16
Fig. 2.71[b]: Dn3-Hall. Summer Solstice 2016
Fig. 2.71[c]: Dn3-Hall. Winter Solstice 2016-17
Fig. 2.71[d]: Dn3-Hall. Summer Solstice 2017
A diagram, based on the situation at Midsummer, was drawn up to consider the impact on data if it came from locations of various heights above bedrock along the length of vector Dn3 (see Fig. 2.72 below). Knowing that the 'Central' Inflection Point (IP-X) stood within the house at approx. 3.0 m above the bedrock mass, meant that the observations at Exterior 'Ground Level' locations beyond the house, in the NW sector at Dn3-Steps or in the SE sector at Dn3-Rear Terrace, were obviously being taken at a greater height above the bedrock, irrespective of their height a.s.l. Therefore, results from some 'exterior' locations along the length of vector Dn3 occasionally related to the 'positive' Zone (+) which corresponded to Dn3-1st Floor (situated in the Upper Zone (+) above IP-X); but sometimes they would be in the 'negative' Mid Zone (-) and thus related to Dn3-Hall/Ground Floor (situated below IP-X): the actual location's position on the wave entirely dependent on whether wavelength was in an expanding phase or contracting at the time.
Fig. 2.72: Diagram of Vector Dn3 Waveform at Midsummer.
However, to measure the size of the wavelength that existed at any one point in time could only be done with a greater degree of certainty once a second Inflection Point was clearly pinpointed and then its complementary movement confirmed in relation to shifts of the first 'Central' IP-X. Early on in the investigation, it had been thought that the oscillation features at Dn3-Steps related primarily to the movements of the 'positive' Upper Zone (+) within the house at Dn3-1st Floor but, as has just been pointed out, Dn3-Steps had features which, in the Winter Period linked it to Dn3-Hall/Ground Floor and to the wave's 'negative' Mid Zone (-). The production of 'Horizontal Plane + Time' graphs covering the period 2015-17 illustrated in slightly more detail how Dn3-Steps only moves in unison with Dn3-1st Floor in the Summer (see Fig. 2.73[a]) and how it then switches to moving with Dn3-Hall throughout the Winter (see Fig. 2.73[b] below).
Fig. 2.73[a]: Dn3-Steps compared with Dn3-1st Floor. Oct., 2015 to Sept., 2017.
Fig. 2.73[b]: Dn3-Steps compared with Dn3-Hall. Oct., 2015 to Sept., 2017.
Such results suggested that Dn3-Steps must actually occupy a position close to the 'Lower' Inflection Point (IP-Λ) most of the time. The local geometry was such that even a slight change of wavelength upwards could cause the recorded pattern of movement at Dn3-Steps to shift in the opposite direction to that at Dn3-Hall, as appeared to happen in the summer. On the other hand, a slight downwards change of wavelength direction was suggested by the results from the Winter period - when Dn3-Steps and Dn3-Hall appeared to move together and thus, indicated that they were in the same 'negative' Mid Zone (-).
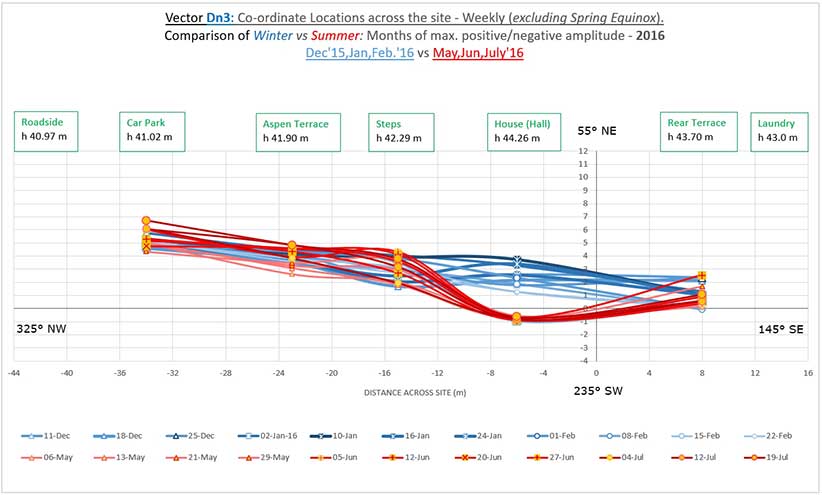
The twisting form of the wave along the length of Vector Dn3 was conveyed by the 'Ground Level' collection of weekly graphs shown in Fig. 2.74 below. It compares the three 'winter' months (Dec'15/Jan/Feb'16 - Blue) with the three 'summer' months (May/June/July'16 - Red) and depicts the alternation from side to side 'positive to negative' within the house and shows the 'cross-over' points indicating the likely position of the 'Low' IP-Λ.
Fig. 2.74: Vector Dn3. Ground Level Weekly Plan View. Winter 2015/16 cp Summer 2016.
In the lead-up to the 2017 Aphelion on 3rd July, measurements were made at a series of heights at several points along a 59-metre length of Vector Dn3. When plotted in plan-view they subtly illustrated this Low Zone (+) vs Mid-Zone (-) arrangement of the wave – which was draped across the bedrock and twisted across the site (see fig. 2.75 below).
Fig. 2.75: Vector Dn3. Ground Level Plan View.
When this same 3rd July data was viewed in the vertical plane (see fig. 2.76 below) the upwards SW curve of the three Dn3 points in the western segment highlighted their position in the 'Positive' Low Zone (+). Simultaneously in the eastern segment, within the house at Dn3-Hall Ground floor and at Dn3-Rear Terrace, the curve rose upwards to the NE, indicating both locations were in the 'negative' Mid Zone (-).
Fig. 2.76: Vector Dn3 Vertical Sections at 5 points on 3rd July 2017.
The individual points arrangement within the wave was more clearly illustrated when their vertical sections were placed at their correct heights within a section CC diagram, which also included the the 1st Floor
angle of
Dn3 within the Upper Zone (+). In addition the diagram highlighted the proximity of
Dn3-Steps to the wave's Low IP-Λ on 3rd July 2017 (see fig. 2.77 below).
Fig. 2.77: The wave form on 3rd July 2017, outlined by 5 points along Vector Dn3 in compressed view.
A notable element of the twisting waveform in the majority of Horizontal Plane graphs across the site was the change in position of the inflection point. This 'cross-over' point could shift horizontally by as much as 15 metres, which again suggested 'expansion & contraction' of wavelength was occurring. The range appeared likely to be greatest at locations where the bedrock slope angle was shallow (≤ 4°). This was illustrated by a comparison of the Dn3 'cross-over' point positions in 2017 (shown in fig. 2.77 below) with those of the previous year (shown in fig.2.74 above): a substantial variation between the two years can clearly be seen.

Fig. 2.77: Vector Dn3. Ground Level Weekly Plan View. Winter 2016/17 cp. Summer 2017.
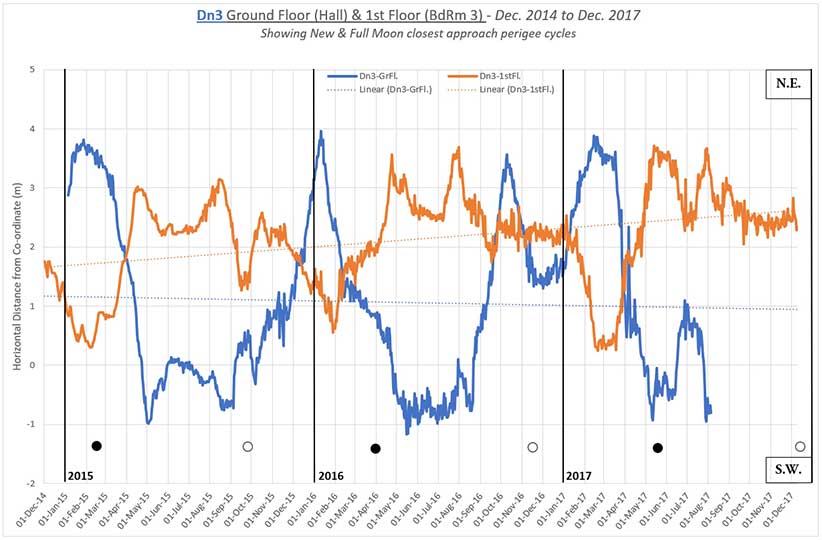
Graphs of daily data, for the 3-years 2015/16/17, showed that when the annual oscillating movement at Dn3-1st Floor (see fig. 2.78[a] below) was viewed alongside that at Dn3-Hall (fig. 2.78[b]) one was almost the mirror image of the other.
Fig. 2.78[a]: Dn3-1st Floor, Years 2015/16/17.
Fig. 2.78[b]: Dn3-Hall/G.L. Years 2015/16/17.
Nevertheless, when the same 3-year period was displayed in a single timeline (see fig.2.79 below) their linear trend lines appear to be moving steadily apart since the Lunar Standstill in 2015 thus, hinting that possibly a larger cyclical period might also be involved. However, with regard to the shorter, 7-month Lunar Perigee/Apogee cycle, (also marked on the graph) or the monthly 29.5-day cycle, it was clearly impossible to draw any firm conclusions if based only on 'Interior' data.[1]
[1] Daily Lunar activity within the building has already been demonstrated to be minimal compared with 'Exterior' locations free from enclosure by large vertical masses; and viewed in isolation the graphs below were limited by depicting the situation at only two points in the horizontal plane.
Fig. 2.79: Dn3-Hall/G.L. & 1st Floor, showing trend lines over the period 2015/16/17.
With regard to the characteristic Annual summer 'double peak - separated by a small dip' seen consistently on the 'Interior' graphs of vector Dn3 – this feature added yet more weight to the idea that in the Spring the wave-shape passed 'upwards' through the Ground Floor, paused at Aphelion and then 'descended' back down in the Autumn. In 3-dimensions, part of this movement could be seen in the changing vertical shape of the wave at ground level: thus, it became distinctly curved during its peak at both the Summer Solstice/Aphelion of 2016, and 2017 (refer back to the vertical section graphs of vector Dn3 in figs.2.71[b]) & [d]). During the Winter Solstice the wave's shape appeared to be slightly different and at less of an angle.
However, there was an apparent contradiction in that Dn3-1st Floor also displayed a double 'peak & dip' in the horizontal plane; and yet the location showed no obvious sign of the wave moving upwards.
* NOTE: It was not realized at the time that, if wavelength was decreasing, it could appear to be 'rising' at one observation point but be simultaneously 'falling' at another due to shrinkage and the distance between the two points. Again, lack of familiarity with how a wave is likely to behave under these conditions was a handicap. Further study was required to gain a fuller understanding of what was actually going on.
If annual changes in wavelength were indeed occurring, then evidence of them ought to be apparent in data from other locations around the site. Bearing this in mind, an 'Exterior' segment of vector De6 was re-examined. Graphs of 'Weekly Vertical' data from De6-Patio spanning the year from March 2016 to February 2017 were divided into in two contrasting six-month periods – Summer (Spring to Autumn Equinox 2016) vs Winter (Autumn to Spring Equinox 2017). The two sections had quite different forms. During the 'Summer' period (see fig. 2.80[a] below) most of the oscillations had a linear, upwards sloping angle towards 'negative' NW, with minimal signs of an inflection point within accessible vertical field of view (h. 1.5 m); except for a notable curve at the Full Moon Apogee of 22th April'16 - which was perhaps an indication of a change of wavelength and a 'High' position for IP-X.
Fig. 2.80[a]: De6-Patio Weekly 'Summer': March to August 2016.
By contrast, 'Winter' wave oscillations were more evenly distributed and lay in the 'positive' SE sector (see Fig. 2.80[b]). They appeared to oscillate around a Low positioned IP-X (0.5 – 0.75 m above GL – with depth to bedrock ≥0.5m). This added further evidence in support of a change of wavelength taking place from summer to winter.
Fig. 2.80[b]: De6-Patio Weekly 'Winter' Sept'16 to Feb.'2017.
When the pattern of vertical movement at De6-Patio was compared with the Winter 2017 lunar oscillations at Pe3[a]-Upper Courtyard (refer back to Figs. 2.63/64/65 shown towards the end of the previous section) the arrangement suggested that De6-Patio was located very close to the 'Central' IP-X in Winter. By contrast, the Pe3[a]-Upper Courtyard location was closer to the bedrock and appeared to remain in the 'negative' Low Zone (-) below the inflection point. Further, the whole of vector De6 had a narrow 'hour-glass' shape within the building when seen in plan-view (refer back to fig 2.54) this again suggested that it was indeed close to the wave's 'Central' Inflection Point IP-X. In addition, it seemed possible that minor changes of wavelength might be accountable for the oscillations occurring from New Moon to Full Moon but more evidence was required to back up such a notion.
Approx. 7.0 m south-west of the Patio, at De6- Lawn, the 'Daily' horizontal plane movements at ground level showed that at the time of the Full Moon perigee peak (28th Sept. 2015) oscillations shifted towards 'negative' NW (refer back to fig. 2.53 in previous section) Seven months later, at the next perigee peak, spanning the New Moon (7th April 2016) oscillations were found to be shifting again towards 'negative' NW (refer back to fig 2.57 in previous section) This initially led to the assumption that the Perigee position of the Moon might be the critical factor governing the 'Negative' phase of the wave, but anomalies existed suggesting this was not necessarily the case. For instance, in the intervening 'Winter' period (Oct./Nov'15) a large SE drift occurred and subtle lunar oscillations shifted in a 'positive' SE direction at Full Moon followed by a reverse to 'negative' NW at New Moon (refer back to fig. 2.60 & 2.61 in previous section). Significantly, this movement appeared to match the 'Winter' Lunar oscillation pattern recorded at Pe3-Upper Courtyard in 2015/16 and also in 2016/17.
The apparent switch of Full Moon from negative to positive that took place in the Autumn of 2015 required an explanation. Perigee position, although important, did not appear to be the critical factor; another possibility for consideration was the connection with Node position and the Minor Lunar Standstill that had occurred between 3rd – 18th Jan., 2015. Evidence presented earlier showed that Lunar oscillations in the 12 months just after the Standstill were barely discernible at any of the locations under observation at that time. However, other contradictions existed at De6[a]-Lawn making the development of a consistent theory to account for this Lunar movement one that, in the short term, was problematic.
However, using a slightly different approach, the 2016/17 daily data for De6[a]-Lawn was divided into 13 consecutive lunar cycles (see fig.2.81 below). This method of analysis showed that in the two periods on either side of midsummer (i.e., in lunations spanning May/June & Aug./Sept./Oct.) the Full Moon oscillated towards the 'negative' NW sector; but in the intervening Midsummer period the Full Moon oscillation underwent a reversal similar to that occurring at Dn3-Hall & 1st Floor and consistent with the Low IP-Λ passing upwards through the location as noted previously. By contrast, throughout the 'Winter' half of the year (Jan to Mar., 2016 & Nov'16 to Jan., 2017) the Full Moon polarity switched and remained oscillating in a 'positive' SE direction.
Fig. 2.81: De6-Lawn Daily. 13 Lunar Cycles Jan., 2016 to Feb., 2017.
The movements at De6[a]-Lawn had suggested that in the vertical plane the location lay in the 'Mid-zone' area somewhere between bedrock and the first clearly identified 'Central' Inflection Point (IP-X) - which lay some 3.0 metres or so above it. If corresponding movements were found within this same 'Mid-zone' height in the vertical plane at other 'Exterior' locations, then in theory predictable pattern of events might be established.
Thus, at 'Mid-zone' height over the five-month Winter Period when the Annual 'solar' wave could be expected to be moving horizontally in a 'positive' Easterly direction, the Full Moon oscillations might be expected to move in the same positive direction - while those of New Moons would shift in the opposite, 'negative' Westerly direction.
Conversely over the five-month Summer Period, the annual 'solar' pattern and the lunar oscillation pattern would in theory be expected to undergo a reversal - becoming a mirror image of the Winter pattern (the actual 'Polarity Switch' occurring in the lead-up to the Vernal Equinox). Thus, Full Moon movements in Summer would tend to oscillate towards 'negative' West while New Moon movements would oscillate towards 'positive' East within the same zonal height.
